
Portfolio dashboard
What every panel on the dashboard shows, where each figure comes from, and where a careful reader can be misled.
Where the dashboard lives
The dashboard is part of the macOS app and covers every company in the workspace. Haruno calls each company a client; that is the word in folder names, commands and the dashboard.
The review runs in the macOS app today. To share the dashboard, export it as a PDF. It carries every company in the workspace, with their findings and reconciliation status, so choose who receives it accordingly.
Every close regenerates it from the workspace ledger. Nothing on the page is typed in by hand. With more than one company in the workspace it opens on the portfolio view; with one, on that company's page.
In the macOS app, open the dashboard from the sidebar: see The sidebar and its views.
See The investor report.
Reading rules that hold everywhere
Six conventions run through every view. Most misreadings come from one of them.
Rounded in tiles, exact in tables. Tiles and chart labels round ($1.4M, $334k). Tables show whole dollars ($1,442,000), with negatives in parentheses. Hover a chart's dot or bar for the exact figure.
A blank is not a zero. A dash (—) means the figure could not be stated. A grey sentence where numbers should be is a refusal, and it says why. The close names what it cannot measure instead of guessing.
Four zeros that may be blanks.
- Cash reads $0k when no account number matches the company's cash prefixes (by default, account numbers beginning with 10).
- Statement tie-out reads “ties” when the balance sheet has no CHECK row to test. The CHECK row is the company's own row that proves the balance sheet, normally total assets less total liabilities and equity.
- Recon exceptions reads 0 and “all schedules tie” when the company sent no reconciliation binder for the close month, as well as when every schedule ties. The Reconciliation status card tells the two apart: it says “No reconciliation binder ingested for this close.”
- A spending category reads $0 in a month with no activity.
What the colours mean. Green: ties, clean, reconciled. Amber: needs a look, or past a first threshold. Red: an exception, a gap, or past the worst threshold. Bold with no colour: a large move the page will not call good or bad.
Which way is up. Burn above zero means cash went down. A budget percentage above zero means actual ran above budget, which is bad for a cost and good for revenue; the page does not decide which. A period-over-period percentage keeps the sign of the earlier figure, so a loss deepening from ($635k) to ($656k) reads +3.3%.
One currency per company. Amounts are in each company's reporting currency and are never converted. “$” means US dollars; any other currency prints its code, as in EUR 5.0M. Portfolio totals refuse to add companies that report in different currencies.
Moving around
Two rows of chips sit under the title on every view.
| Chips | What they do |
|---|---|
| Client | “Portfolio” shows every company together. A company's name opens its page, as does its name in the Clients table. |
| Period | “All”, “Last 6 mo” or “Last 3 mo”. Trims four panels only: Cash, Monthly burn, Operating expenses by category with its Category detail, and the Variance watchlist. The choice stays when you switch companies. |
The tiles and every other card always cover the whole close. Period over period has its own Month, Quarter and Year switch. Everything is monthly: nothing in the ledger is finer than a month end, so there are no weekly views.
The portfolio view
The portfolio view answers one question: which company needs attention first?
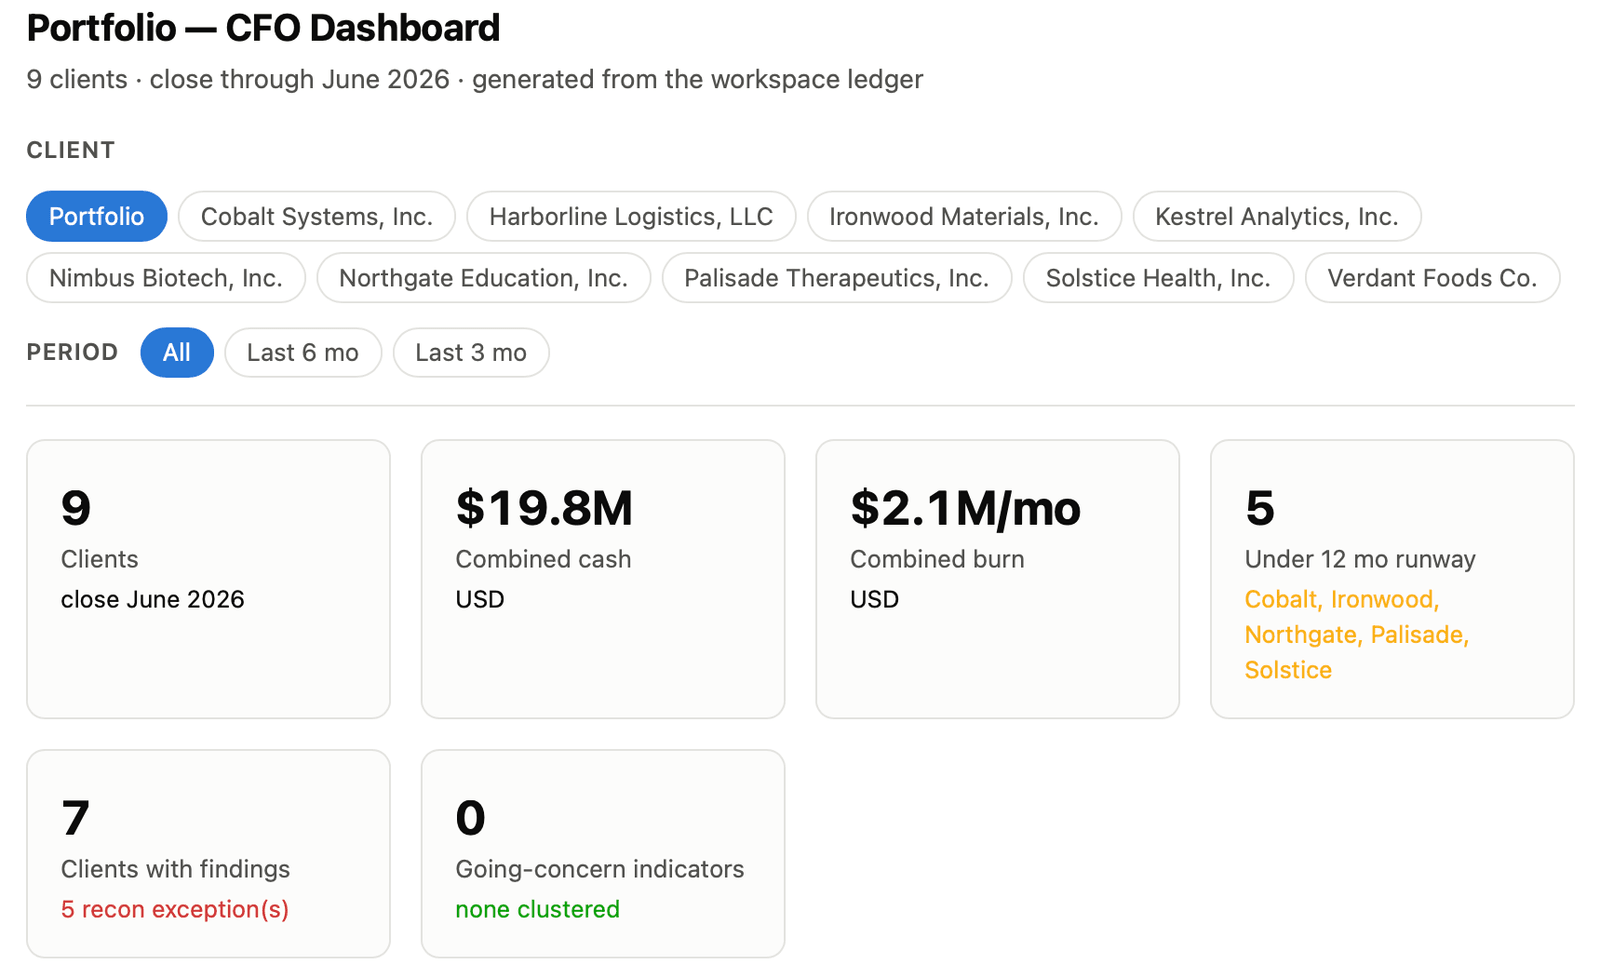
The six tiles
| Tile | What it shows |
|---|---|
| Clients | How many companies are on the page. The month underneath (such as “close June 2026”) is the most advanced company's close, not one every company has reached. |
| Combined cash | Each company's cash at its own close, added up. “—” with an amber note when companies report in different currencies. |
| Combined burn | Each company's three-month average burn, added up, per month. A company whose cash grew counts as zero rather than offsetting the others. |
| Under 12 mo runway | Companies with runway below twelve months, named in amber. A company whose cash is growing has no runway and is not counted. |
| Clients with findings | Companies with at least one open high or medium finding, solvency indicators aside. The line underneath totals reconciliation exceptions. Red whenever any company has findings. |
| Going-concern indicators | Companies whose solvency indicators cluster: two or more, at least one high. “none clustered” in green otherwise. |
What makes a finding open, and how severe it is, is set out in Findings and checks. Some checks use thresholds calibrated on one company's books; treat them as starting points.
Cash by client
One bar per company, longest first, labelled with cash at the close. Hover a bar for the exact figure. With mixed currencies, each name carries its currency code and the bars are not comparable.
The Clients table
One row per company. Click a column header to sort, again to reverse. Click the blue company name to open its page. Only the blue name responds, although the whole row shows a pointing hand.
| Column | What it shows |
|---|---|
| Client, Sector | The company's name and sector. |
| Cash, Burn/mo | The same figures as the company's Cash and Burn tiles. |
| Runway | Cash divided by burn; “n/a” when cash is not declining. Red under 6 months, amber under 12. |
| Worst vs budget | The line furthest from budget for the period, in either direction, as a percentage of its budget to date. “on budget” means no line is off by both $1,000 and 5%; “—” means no budget was imported. |
| Tie-out | “ties”, or the gap on the balance sheet's CHECK row. |
| Recon exceptions | Reconciliation rows in exception at the close. |
| Findings | Open high and medium findings; “clean” when there are none. Low ones are not counted. |
| Close | The close state chip. Hover it for the checks left unresolved. |
| Going concern | How many solvency indicators fired; red when they cluster. |
A company's page
Everything the close knows about one company. A card appears only when the company has the data behind it, so two companies' pages rarely look the same.
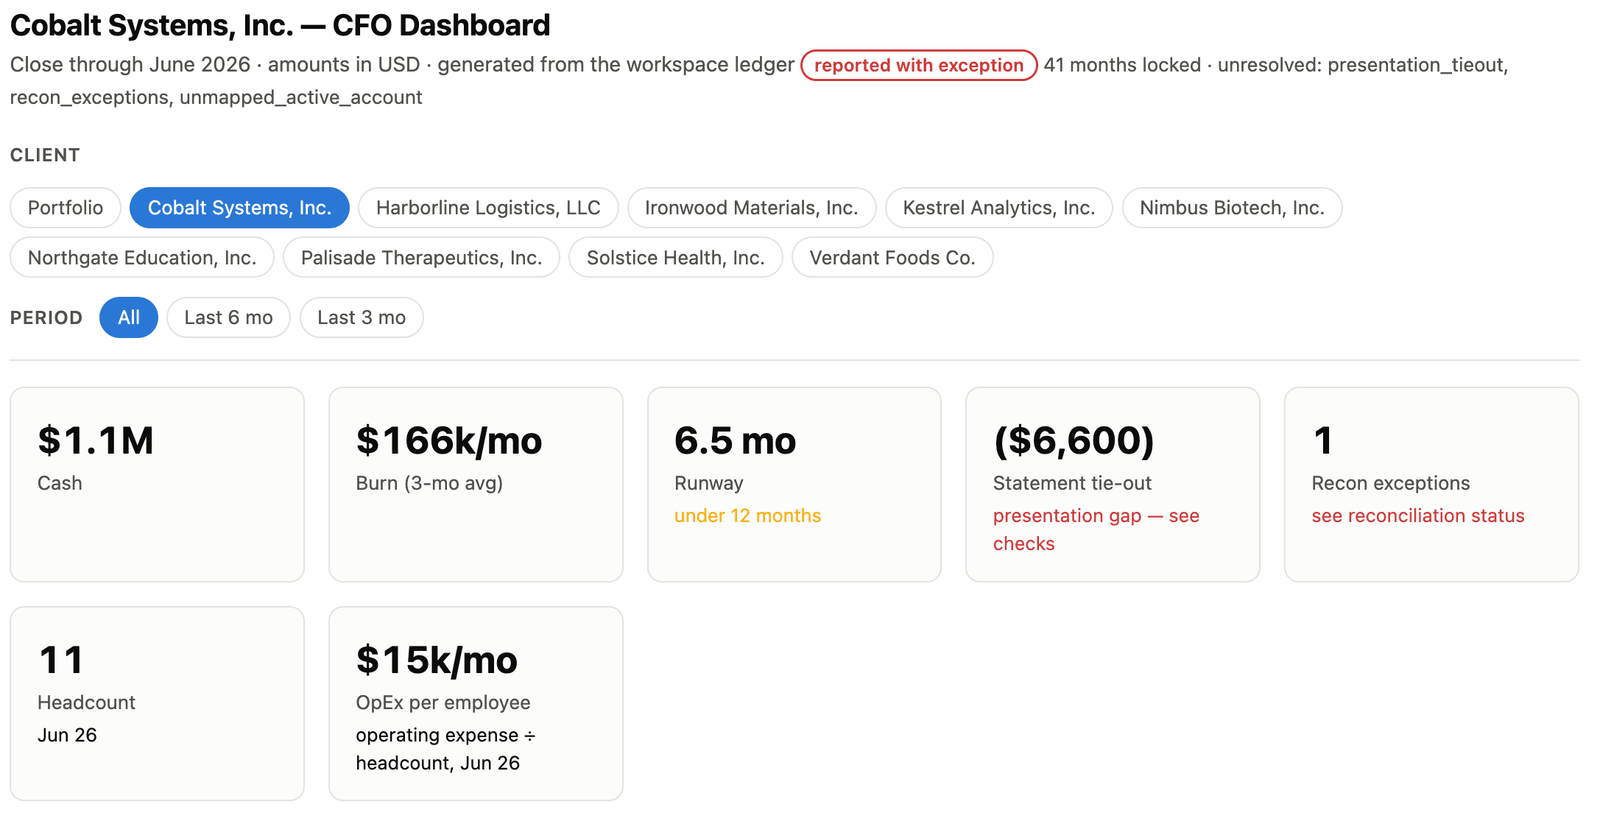
Header and close state
- Close through: the last month the ledger holds a balance sheet for, with the reporting currency.
- The close state chip: fully reconciled (green), reported with exception (red), open (amber) or not recorded (grey). When months disagree, the weakest state wins.
- Months locked (for example “41 months locked”): how many months the close has locked. An import that would change a figure in a locked month is refused until someone reopens the month with a reason. “N still open” counts reported months not yet locked.
- “unresolved:” followed by check names: the checks that were unresolved when the months were locked. It records that moment, not today, and one close writes the same list against every month it locks, so a problem fixed since still reads against all of them.
Cobalt Systems, above, was locked with three checks unresolved, so it reads reported with exception rather than fully reconciled. The lock is not a verdict on the books. See Close states.
Tiles
| Tile | What it shows |
|---|---|
| Cash | Balances at the close on every account whose number starts with the company's cash prefixes (by default, those beginning with 10). It adds the accounts directly, not the balance sheet's cash line. |
| Burn (3-mo avg) | The average of the last three monthly changes in cash. Above zero means cash went down. |
| Runway | Cash divided by that burn, to one decimal. Amber “under 12 months” below a year; “—” when cash is not running out. |
| Statement tie-out | The balance sheet's own CHECK row. “ties” within a cent; otherwise the gap in red. The usual cause is an account with a balance and no statement line. |
| Recon exceptions | Reconciliation rows whose schedule does not match the general ledger to the cent. Rows that could not be computed are not counted. |
| Headcount | Supplied by the company's operating inputs tab or CRM export, never derived from the books. |
| OpEx per employee, Revenue per employee | Total operating expense (not payroll), or the revenue line, divided by headcount. Revenue per employee is absent without a revenue line. |
When there are findings, the page ends with the Integrity findings card: severity, check, subject, what it means, and a Propose a fix button. The checks are described in Findings and checks.
Business-health panels
The first five cards ask whether the business is healthy. Solvency appears for every company; the others only when the company sent what they need.
Solvency and going concern
Can the company meet what it owes? The card shows balance-sheet solvency at the close (current assets and liabilities, working capital, current ratio, cash, total assets and equity, deferred revenue) and the ASC 205-40 going-concern indicators. A Basis column explains the figures that need it, such as the line equity was read from and what the runway rests on. Operating cash flow appears only when a statement of cash flows was imported; where borrowing was presented in operating activities, a corrected row moves it out, as ASC 230 requires.
The four indicators and their severities are in Solvency indicators.
Two or more indicators, at least one high, form a cluster: the card opens with an amber ASC 205-40 paragraph and the portfolio counts the company. A runway from the change in cash never raises an indicator. The card reports the conditions a going-concern evaluation is made about. It never concludes on going concern; the evaluation stays with you. See Solvency indicators.
Collections against revenue
Did the revenue arrive as cash? An estimate from the statements, not from the bank: collected = revenue − Δ receivables + Δ deferred. The gap is amber when a month earned more than it collected. A deferred revenue roll-forward follows; when a billing export or the binder can split its movement into Additions and Recognition, “Why did it move?” opens the rows behind a month.
It is not a bank total: refunds netted elsewhere, write-offs and factoring make it differ from receipts. Days sales outstanding and receivables aging are not on this card.
Gross margin
Revenue, cost of revenue, gross profit and margin, month by month, with a table per revenue stream when the company's spec (its mapping and the judgments you confirmed, kept in one file per company; see Onboarding a company) pairs each stream's revenue and cost lines. It counts only what the company presents above gross profit: a delivery cost booked in operating expenses is not in it, and a note says so. Without a cost-of-revenue line the card refuses rather than show a 100% margin.
Recurring revenue
Shown when billing records were imported: a Stripe invoice export or a revenue-by-customer sheet. QuickBooks has no report that carries it. MRR spreads each billed invoice across its service period; draft, void and uncollectible invoices count for nothing, and invoices with no service period are listed as one-off revenue. ARR is MRR × 12. New, Churned and Net new MRR compare with the previous month. Churn is customer count churn, not revenue churn.
MRR is what was billed, not what was collected. Expansion, contraction and net revenue retention are not computed.
Customer acquisition cost and payback
Shown only when the company's spec declares which profit and loss lines are acquisition spend. That list is never inferred, because no statement caption says which spending wins customers, and a cost per customer is only as true as the list.
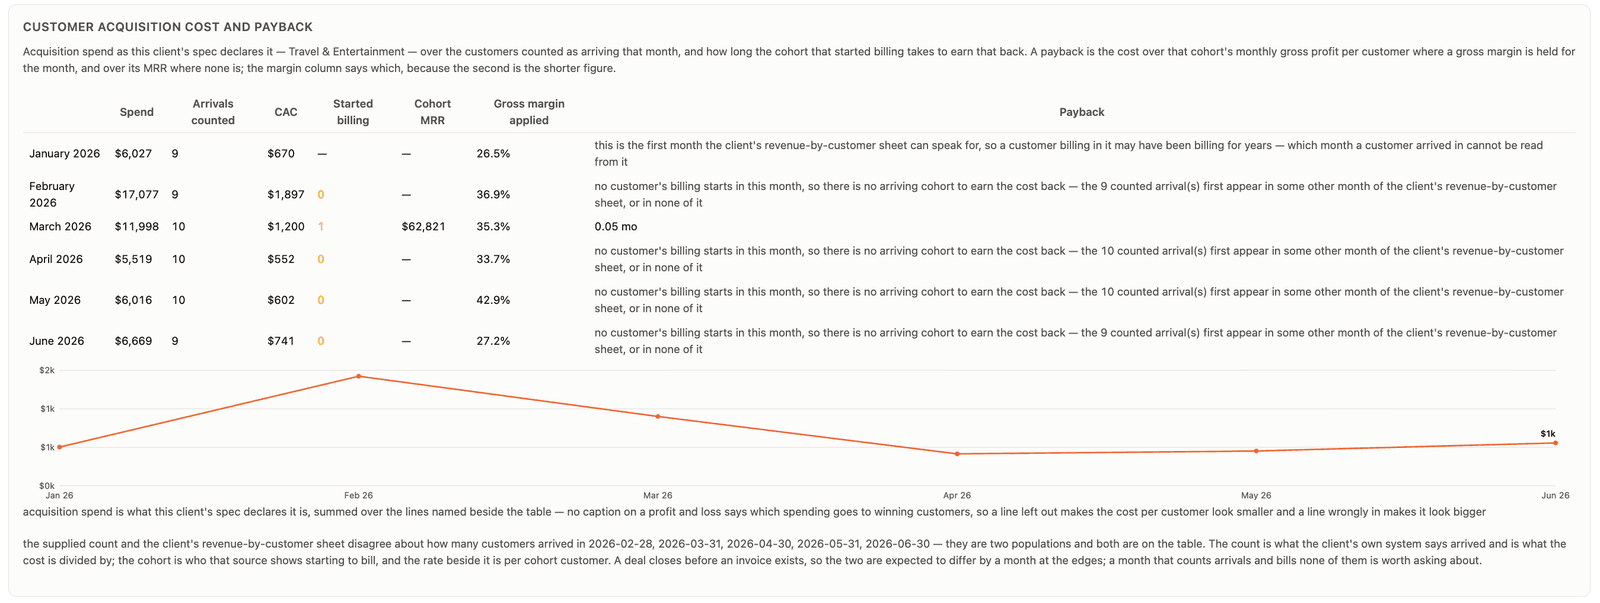
| Column | What it shows |
|---|---|
| Spend, Arrivals counted, CAC | The declared spend, new customers from the operating inputs tab or CRM export, and spend divided by that count. |
| Started billing, Cohort MRR | Customers whose first recurring revenue falls in the month, and what they recur. Amber when it disagrees with the arrivals count; a deal closes before its first invoice, so a month's difference is expected. |
| Gross margin applied, Payback | CAC divided by (cohort MRR per customer × gross margin), in months. Without a margin it divides by MRR alone, a shorter figure; the margin column says which. A grey sentence explains a missing payback. |
A month with no count, or a count of zero, has no CAC rather than an invented one. An expensive customer is a business fact, not a finding.
Spending and variance panels
The rest of a company's page is about spending: where the cash went, what it went on, and how that compares with the plan and with the company's own recent months.
Cash and Monthly burn
Cash plots every month-end the ledger holds. Monthly burn plots last month's cash less this month's: bars above zero are months when cash went down. It is the change in cash, not operating expense.
Operating expenses by category
One stacked bar per profit and loss month. The categories are the lines of the company's own operating-expenses subtotal, not accounts or QuickBooks classes. Click a legend name to open Category detail: the category month by month, its budget as a dashed line when the budget has a line of the same name, and each month against the category's average (red more than 15% above, green more than 15% below).
Operating expense by department
Shown when a Profit and Loss by Class export was imported, one file per month; a month with no file shows “—”, not zero. Not Specified is spending nobody classified, reported on its own. If the departments do not add up to operating expense, a note gives the difference. Nothing is allocated to close it.
Budget vs actual
Shown when a budget was imported. Month columns show actual less budget, so a positive figure is over budget. Actual to date, Budget to date, Δ and Δ % cover the budgeted months of the year to the latest profit and loss month, sorted by the size of Δ. Δ % is bold when material: at least $1,000 and at least 5% of budget to date. There is no red or green, because the card does not decide whether a line is a cost or revenue. Warnings flag a line on budget this month but off for the period, a budget line that matches no statement line, and months with no budget.
Reconciliation status
One row per balance sheet account reconciled in the company's binder for the close month, with the kind of schedule the binder tab was recognised as. Difference is the schedule's own closing balance, recomputed, less the general ledger balance, so a difference typed into the workbook cannot make it tie. Status reads reconciled (green) within a cent, exception (red) for anything more, or open (amber) when no difference could be computed.
Materiality does not soften a status: a $200 difference is an exception. The company's materiality threshold decides only which balances with no schedule are flagged, as recon_coverage findings. See Reconciliation statuses.
Variance watchlist
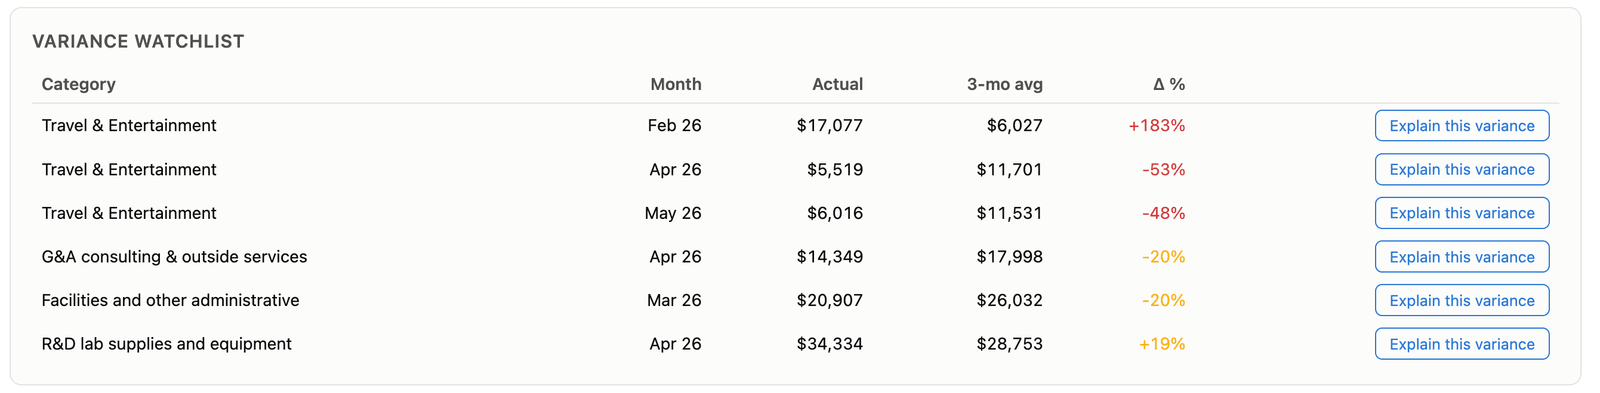
Which months broke from their own pattern? Each spending category against the average of up to three months before it, with no budget involved. A month is listed when it moves at least $1,000 and at least 15% from that average; the six largest by percentage are shown. Red at 25% or more either way, amber below. The first month is never tested.
Period over period
The latest complete month, quarter or year against the one before it, following the company's fiscal year. Balance sheet lines compare balances at the two period ends; profit and loss lines add up each period's months. It shows every subtotal and total that moved plus the six detail lines that moved most, and the note under each table counts the rest. An amber note appears when a month in either period was restated after it was closed.
Three comparisons, three questions
Three panels compare figures, and they answer different questions. They disagree routinely, and correctly. When you quote a number, name the comparison it came from.
| Panel | Compares | Against |
|---|---|---|
| Period over period | The latest complete month, quarter or year | The period immediately before it |
| Budget vs actual | The year to date | What was planned for those same months |
| Variance watchlist | One month of one spending category | That category's trailing three-month average, with no budget involved |
So “we are on budget” and “we are up on last month” answer different questions over different spans. In the synthetic demo, one company's Travel & Entertainment line is 1.8% under budget in June and 14.2% over for the year, because of a February airfare spike no June column can see. Do not answer “on budget” from one column.
A variance is not a finding. Being over budget, or up on last month, is a business fact and shows as a figure. A finding is a problem with the figures themselves: one that is missing, does not add up, or is presented wrongly. For a budget, that means a budget missing months (budget_months_short) or a budget line that matches no statement line (budget_line_unmatched).
- Budget vs actual sums both sides over exactly the months they share. A budget that stops in April is compared with actuals through April, and the missing months are named.
- Where a figure grew from zero or crossed zero, the percentage is left as a dash, with the reason given: −100 to +100 is not up 200%. Use the change in dollars.
- A quarter missing a month is refused, not summed short.
Every line, from the workspace folder
Period over period shows only the largest movements. From the workspace folder, with a standard Python 3, the first command prints every line of that comparison for one company; the second prints the budget comparison in the terminal. Give the company's name as its reports show it, not its folder name.
python3 .haruno/skills/QuickBooksCFO/scripts/ingest.py compare --ledger ledger/ledger.sqlite --client "Cobalt Systems, Inc." --grain quarter

python3 .haruno/skills/QuickBooksCFO/scripts/ingest.py budget --ledger ledger/ledger.sqlite --client "Cobalt Systems, Inc."
The other commands are in Running it yourself.
Asking Haruno from the dashboard
Some buttons put a question into Haruno's chat composer, filled in with the figures on screen. Nothing is sent until you press send, so you can edit it first. The investor report carries none of them.
| Button | Where | What it asks |
|---|---|---|
| Explain this variance | Variance watchlist | Explain the category's variance for that month, against its three-month average. |
| Ask about (month) | Category detail | Explain the category in that month, against its average for the period shown. |
| Draft the disclosure | Solvency and going concern, beside each indicator | Draft the paragraph you would put in front of an investor, stating the indicators and management's plans, and say what would be needed from the company to support it. The draft is wording for you to review; the going-concern evaluation stays with you. |
| Propose a fix | Integrity findings | Propose the spec change that resolves the finding, with its before-and-after effect on the statements. |
| Ask Haruno | The budget, variance, solvency and findings cards on a company's Overview | A question about the largest budget gap, the top variance or the most severe finding. “Staged in chat” confirms it. |
Explain the Travel & Entertainment variance for Feb 26 ($17,077 vs $6,027 3-month average).The dashboard proposes, you decide. A proposed mapping or spec change is recorded only when you confirm it. If it would change a locked month, the close refuses until you reopen that month with your reason.
A staged question carries the figures in it. When you send it, the question and what Haruno's tools print back while it answers (account names, captions, figures, findings) go through Inferara's hosted service to the model provider that answers, as in any conversation. The close itself runs on your machine and sends nothing. See Data handling and security and Asking Haruno.
The sidebar and its views
In the macOS app, the dashboard has its own place in the sidebar. Besides the portfolio and each company's overview, it shows the company's statements, the reconciliation detail and the account mappings, and it redraws itself when a close finishes.
| Part | What it shows |
|---|---|
| Sidebar | Portfolio, then each company with a health dot and a badge counting open findings (red when any is high). The dot is red when runway is under six months or indicators cluster, amber when a high finding is open or runway is under twelve months. |
| All clients | A card per company with cash, burn, runway, findings and close state. Sort by Name, Runway or Findings. |
| Overview | Tiles, Cash and Burn charts with an All · 6M · 3M range picker, operating expenses, budget bars, the variance watchlist, solvency and findings. |
| Statements | Six months of the statement of operations with calendar year to date, and two months of balance sheet, in thousands, with a chip showing whether it ties. |
| Reconciliation | Per GL, Per schedule, Difference and Status. An exception chip opens the itemised rows behind the difference. |
| Mappings | Accounts with activity and no statement line first, then every account with its statement line, marked imported (read from the company's workbook), approved ✓ (confirmed in the spec) or proposed (not yet confirmed). |
When the tab has nothing to show
| Message | What it means |
|---|---|
| Loading CFO data… | The tab is still loading the workspace's figures. |
| No CFO data in (folder) yet | No close has run there, or the folder you opened is not the workspace itself. |
| … Showing the last close that decoded. | A refresh failed; the previous figures stay on screen. |
| Live updates are off | The tab is not following new closes. Reopen it after a close. |
Opening the dashboard sends nothing: it shows figures from your workspace. See Data handling and security.
Quirks worth knowing
Places where the dashboard can mislead a careful reader.
- Findings are counted two ways. The portfolio and the sidebar badge count high and medium findings only; the findings cards also list low ones. A company can read “clean” on the portfolio and still have rows on its card.
- Runway turns red in some places and not others. A company's runway tile only ever turns amber, under 12 months. The Clients table and the sidebar turn red under 6.
- A missing budget month is drawn at $0. In Category detail it sits on the zero line while its tooltip says “—”. It is a missing budget, not a budget of nothing.
- The acquisition table runs off to the right. The Payback column does not wrap; scroll inside the card.